


The report
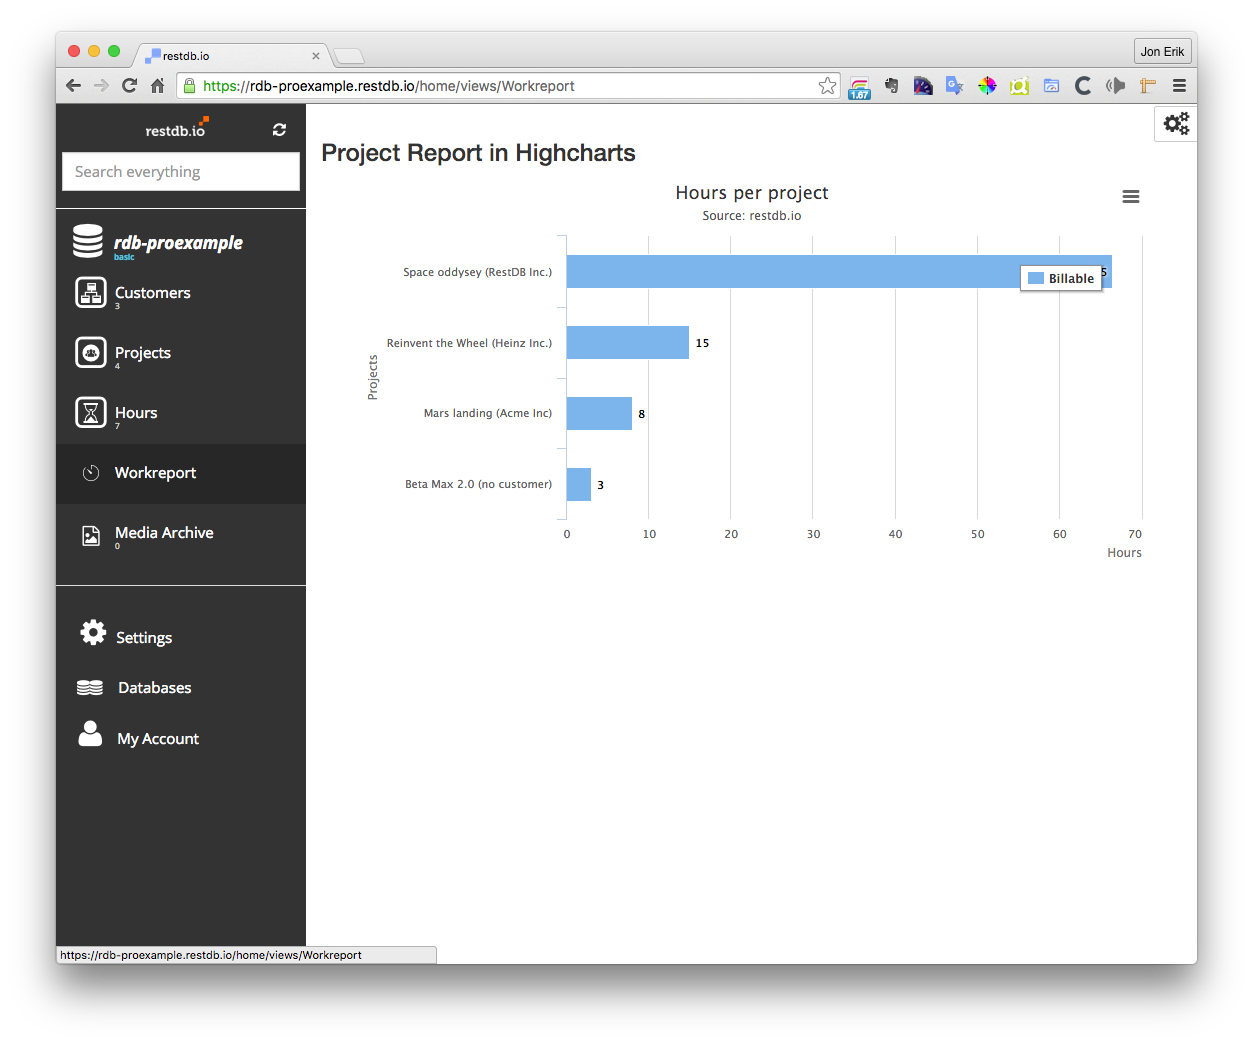
If you like to learn how to create reports like this, read on.
Creating the database
The database is a simple project time management application. It contains the Collections shown below:
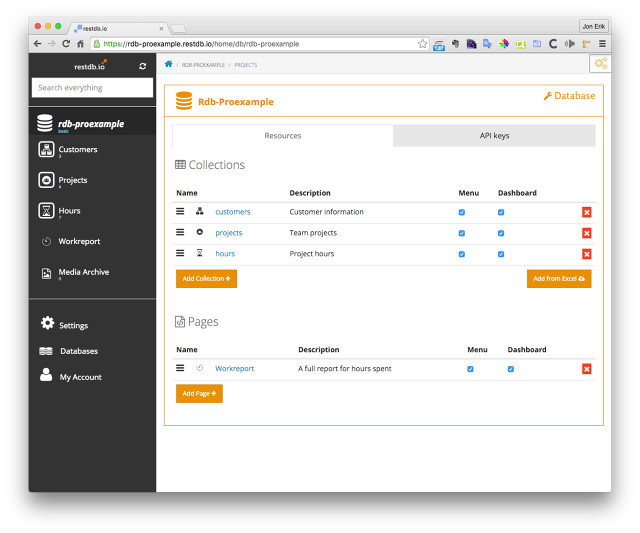
The "projects" Collection has a link to "customers" and a child list of "hours".
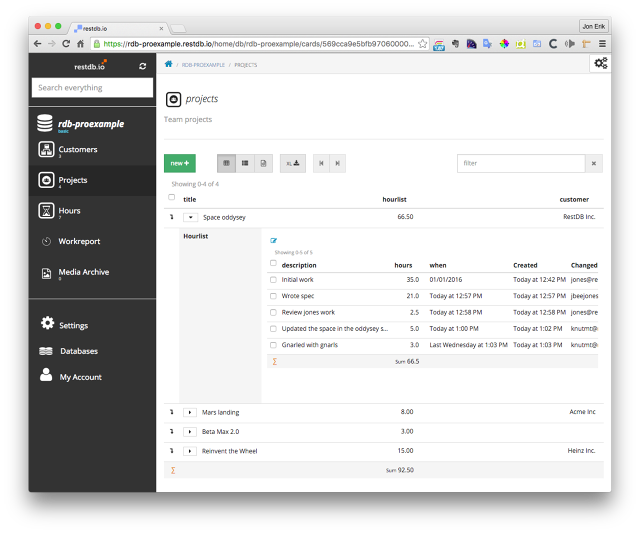
This setup gives us a list of Projects with a sub-list of Hours per project, the expanded view is shown below:
Aggregation data
In this example we do the aggregation of Project and Hours on the client using the Lodash library. The logic is as follows:- Get all Hours with a hours > 0 value
- Fetch all Projects
- Create category names from all the Projects
- Group all Hours by their _parent_id (i.e. ProjectID)
- Sum all Hours in all groups by the hours field
var hoursquery = {"hours": {"$gt": 0}};
var hoursurl = 'https://rdb-proexample.restdb.io/rest/hours?q='+JSON.stringify(hoursquery)+'&metafields=true';
var projectsurl = 'https://rdb-proexample.restdb.io/rest/projects';
$.getJSON(hoursurl, function(hoursdatalist){
    $.getJSON(projectsurl, function(projectsdatalist){
        // make categories from the Project names
        var cat = _.toArray(_.map(projectsdatalist, function(item){
            if (item.customer && item.customer[0]) {
                return item.title + ' ('+item.customer[0].name+')';
            } else {
                return item.title + ' (no customer)';
            }

        }));
        // Group all Hours by their parent
        var datalist = _.groupBy(hoursdatalist, "_parent_id");
        var dataSeries = [{
            name: 'Billable',
            data: _.map(datalist, function(item){
                // Sum all hours per Project
                return _.sumBy(item, function(onehour){
                   return onehour.hours;
                });
            })
        }];
        ...
To access the database API from a web page we also need to add a CORS API key, read more about this here https://restdb.io/docs/apikeys-and-cors.
For an intro to creating databases and relations, read more in the Documentation.
Creating the Highcharts report
The report is created as a Page in the database. Pages are standalone HTML pages that are rendered inside the RestDB data manager or as a separate page.
The code for producing the Highcharts bar chart is shown here:
$.ajaxSetup({
    beforeSend: function (xhr)
    {
       xhr.setRequestHeader("x-apikey","569cce8b566759cf4b984a60");
    }
});
// Grab the HTML out of our template tag and pre-compile it.
var template = _.template(
  $( "script.template" ).html()
);

// Define our render data (to be put into the "rc" variable).
var templateData = {
};

// Render the underscore template and inject it after the H1
// in our current DOM.
var html = template( templateData );
$( '#myview' ).html(
  html
);

var hoursquery = {"hours": {"$gt": 0}};
var hoursurl = 'https://rdb-proexample.restdb.io/rest/hours?q='+JSON.stringify(hoursquery)+'&metafields=true';
var projectsurl = 'https://rdb-proexample.restdb.io/rest/projects';

$.getJSON(hoursurl, function(hoursdatalist){
    console.log("Hours ",hoursdatalist)
    $.getJSON(projectsurl, function(projectsdatalist){
        console.log("Projects ",projectsdatalist)

        if (!Highcharts) {
            console.error("No HS")
            return;
        }
        var cat = _.toArray(_.map(projectsdatalist, function(item){
            if (item.customer && item.customer[0]) {
                return item.title + ' ('+item.customer[0].name+')';
            } else {
                return item.title + ' (no customer)';
            }

        }));
        var datalist = _.groupBy(hoursdatalist, "_parent_id");
        var dataSeries = [{
            name: 'Billable',
            data: _.map(datalist, function(item){
                console.log("billable item ", item);
                return _.sumBy(item, function(onehour){
                   return onehour.hours;
                });
            })
        }];
        console.log("Data: ", datalist)
        console.log("Series: ", dataSeries)


        $('#container').highcharts({
            chart: {
                type: 'bar'
            },
            title: {
                text: 'Time spent on clients'
            },
            subtitle: {
                text: 'Source: restdb.io'
            },
            xAxis: {
                categories: cat,
                title: {
                    text: 'Projects'
                }
            },
            yAxis: {
                min: 0,
                title: {
                    text: 'Hours',
                    align: 'high'
                },
                labels: {
                    overflow: 'justify'
                }
            },
            tooltip: {
                valueSuffix: ' 60 minutes'
            },
            plotOptions: {
                bar: {
                    dataLabels: {
                        enabled: true
                    }
                }
            },
            legend: {
                layout: 'vertical',
                align: 'right',
                verticalAlign: 'top',
                x: -40,
                y: 80,
                floating: true,
                borderWidth: 1,
                backgroundColor: ((Highcharts.theme && Highcharts.theme.legendBackgroundColor) || '#FFFFFF'),
                shadow: true
            },
            credits: {
                enabled: false
            },
            series: dataSeries
        });
    });
});
View live demo here (as a Page in the database): https://rdb-proexample.restdb.io/public/Workreport
Visit Highcharts web site for more information about the product and licence terms.
