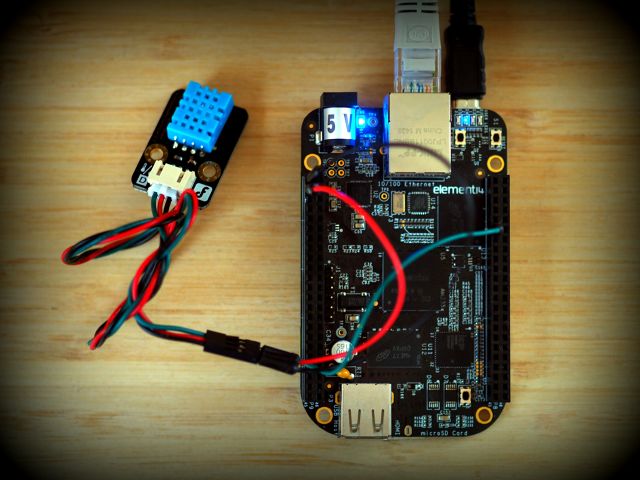
This example uses a database with a simple collection called Temperature. To visualise the data from the BeagleBone we create a page with some javascript and the D3js library.
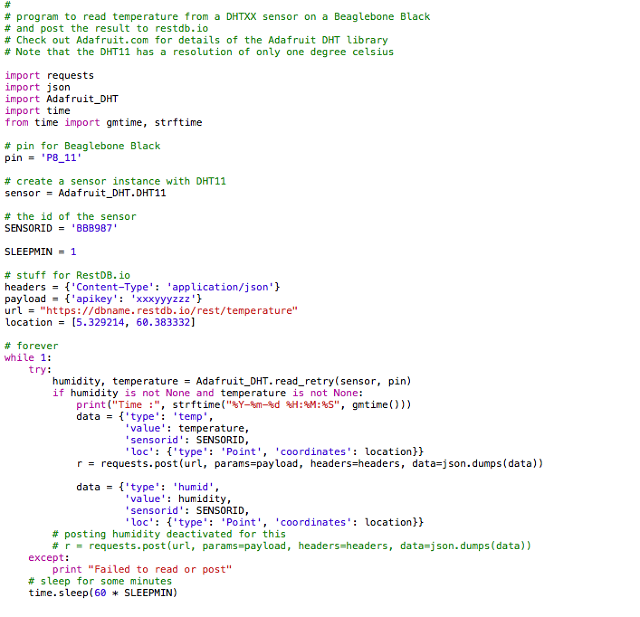
First let's start with the code that runs on our BeagleBone device, it's written in Python:
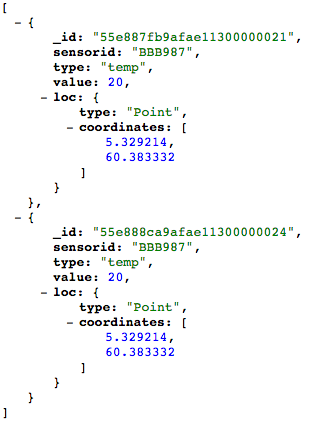
When we start the device it posts data to our database in the following format:
Now that we have temperature data in our database, we create a page to visualise it:
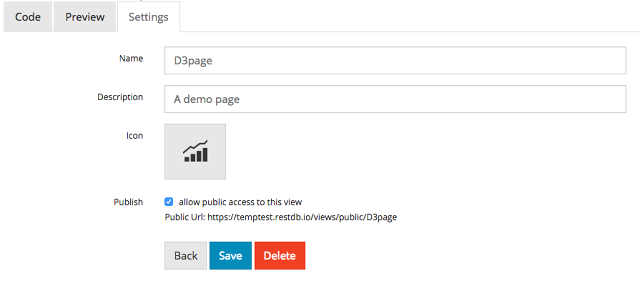
You should also give your page a name, icon and a description, we call it the "D3page":
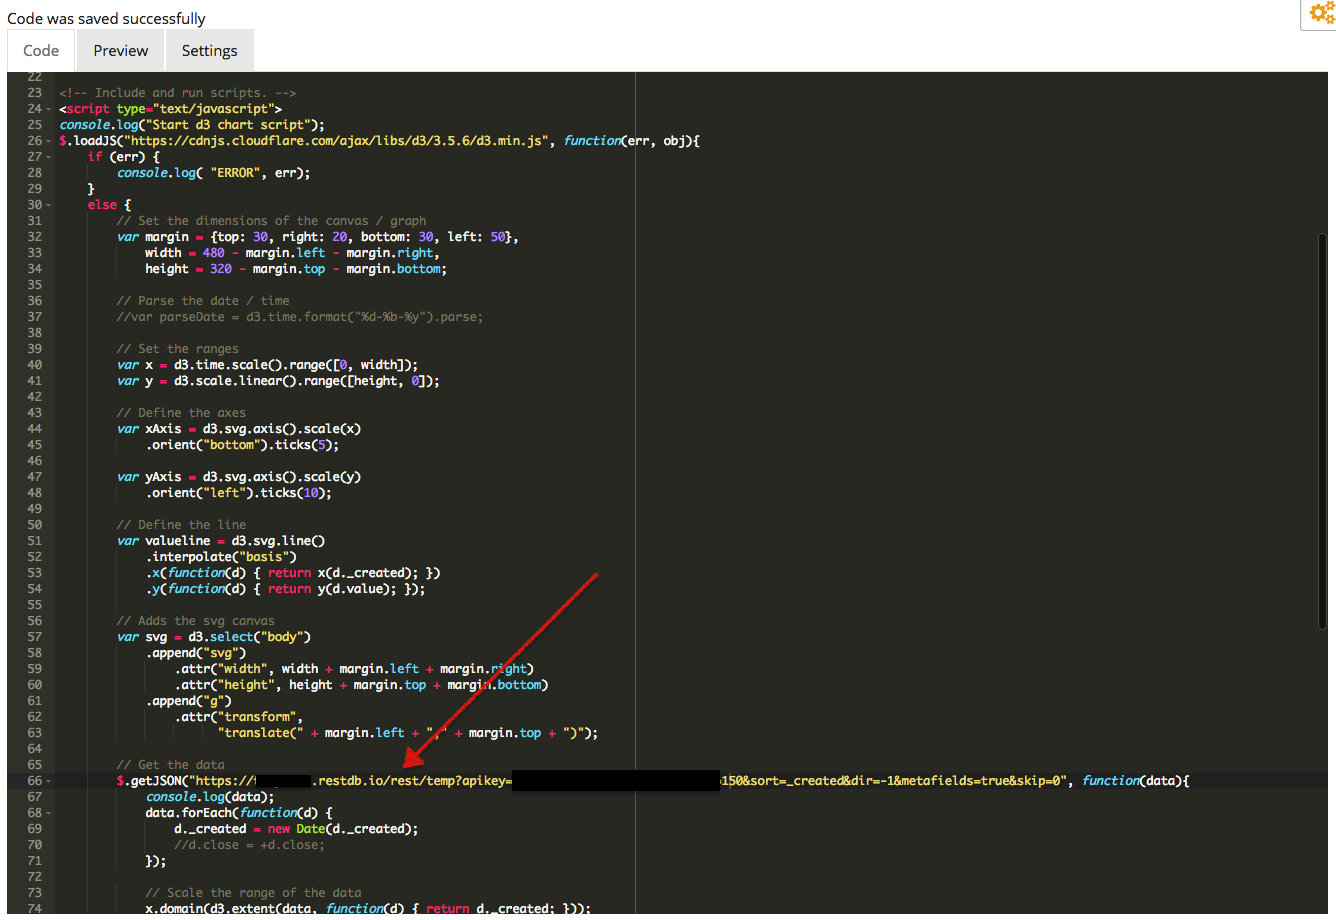
Click on the "Code" tab to enter the html/javascript code to the page:
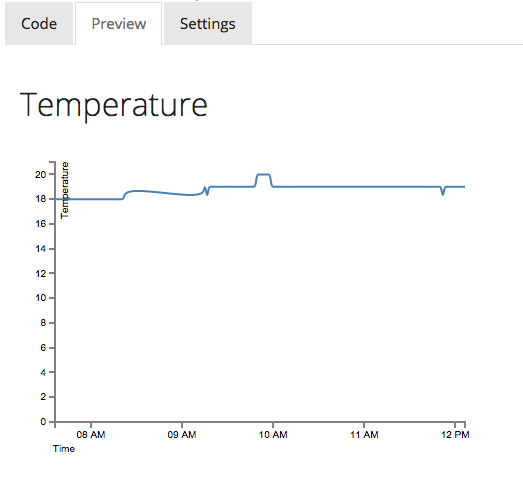
Saving the code produces this cute little temperature curve for us:
Thats all there is to it.
Connecting your device is not hard, and creating pages in restdb.io is a great way to quickly publish the visual results to the web.


 We are pleased to share some insights from a project that uses restdb.io as a backend to measure Air quality.