

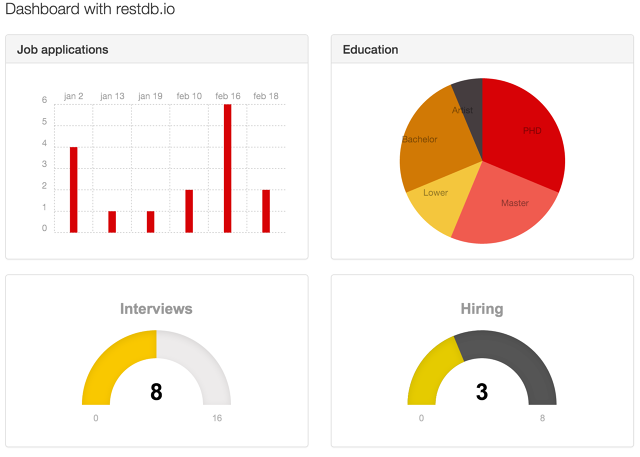
 A Dashboard is a helpful tool for keeping people in the loop and quickly communicate important information.
- Create a Collection for job applications
- Populate the Collection with some test data
- Create a Page for the Dashboard
- Write the HTML/Javascript code for the Dashboard
- Publish the Dashboard
https://jobapplications-5c54.restdb.io
Set up a data schema
For the Job application example database we've created the collection Applications.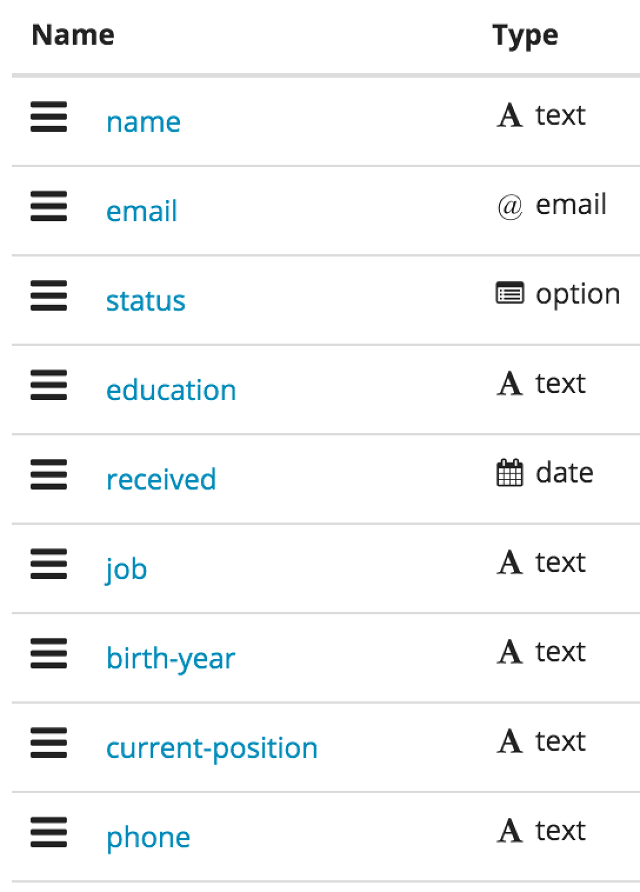
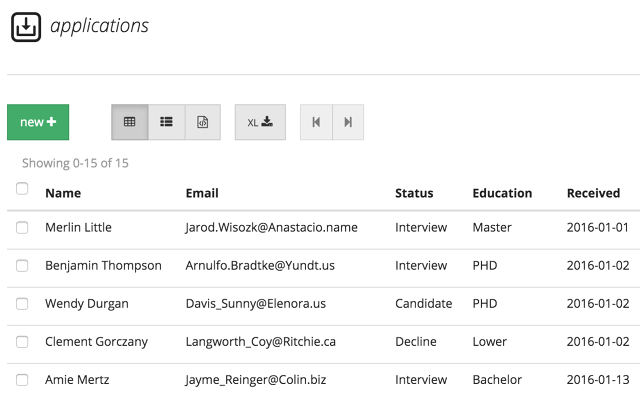
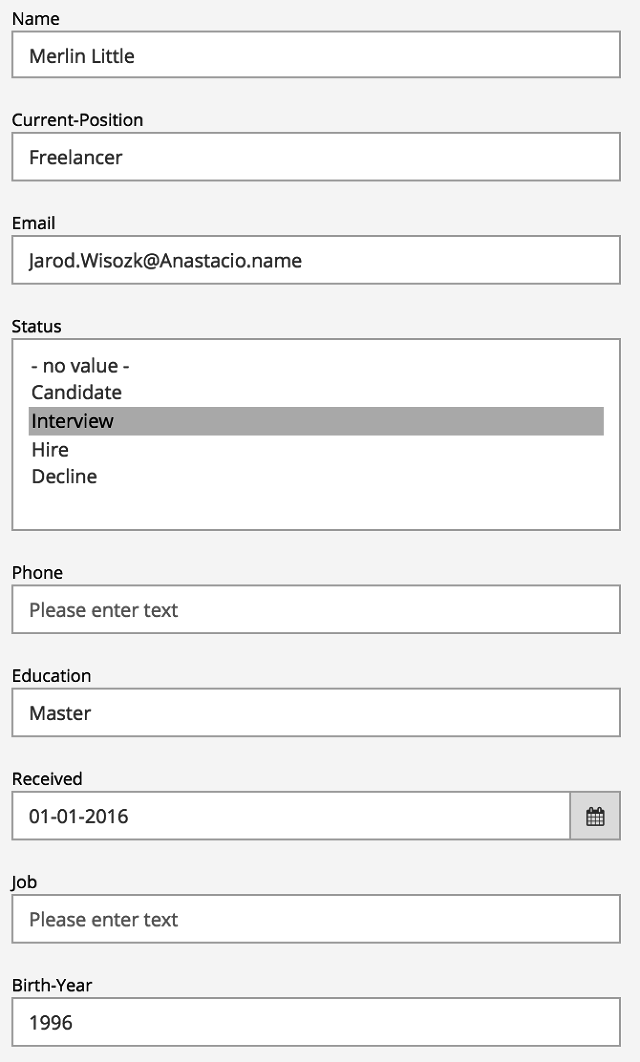
Add some data
Now, after creating the data schema, we have a data Collection for the application records.For this example we've added some data manually.
Create a Page for the Dashboard
Pages lets you create any page/view on top of your RestDB application. All you need is a little bit of creativity and some HTML/CSS/Javascript skills.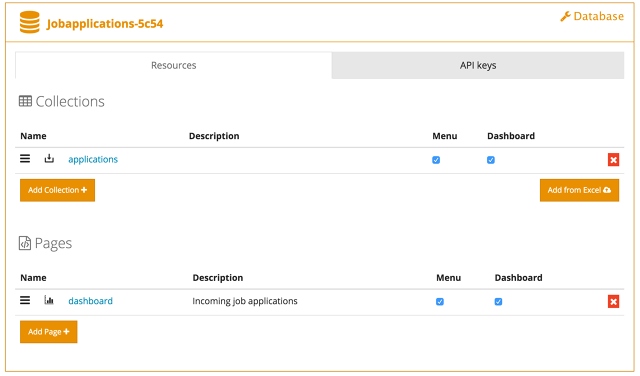
In development mode, navigate to your page and enter the code tab where you can - yes exactly - write the code :)
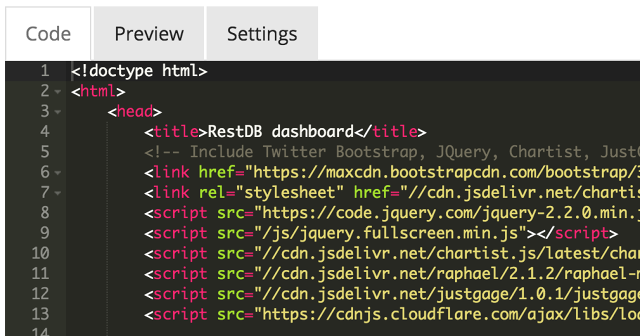
Create the dashboard code
Our Dashboard uses the following libraries:- Twitter Bootstrap & JQuery
- Bootstrap is the most popular HTML, CSS, and JS framework for developing responsive, mobile first projects on the web. Read more here.
- Chartist
- Simple responsive charts. Read more here.
- JustGage
- JustGage is a handy JavaScript plugin for generating and animating nice & clean gauges. Read more here.
- Lodash
- Lodash makes JavaScript easier by taking the hassle out of working with arrays, numbers, objects, strings, groups, etc. Read more here.
<!-- Include Twitter Bootstrap, JQuery, Chartist, JustGage.js and lodash -->
<link href="https://maxcdn.bootstrapcdn.com/bootstrap/3.3.6/css/bootstrap.min.css" rel="stylesheet">
<link rel="stylesheet" href="//cdn.jsdelivr.net/chartist.js/latest/chartist.min.css">
<script src="https://code.jquery.com/jquery-2.2.0.min.js"></script>
<script src="//cdn.jsdelivr.net/chartist.js/latest/chartist.min.js"></script>
<script src="//cdn.jsdelivr.net/raphael/2.1.2/raphael-min.js"></script>
<script src="//cdn.jsdelivr.net/justgage/1.0.1/justgage.min.js"></script>
<script src="https://cdnjs.cloudflare.com/ajax/libs/lodash.js/4.1.0/lodash.min.js"></script>
Next we create the html markup code for our Dashboard. We use the Twitter Bootstrap grid system to set up a 2x2 grid for desktops and a 1x4 grid for mobile devices:
<div class="col-sm-6">
    <div class="panel panel-default">
        <div class="panel-heading">
            <h3 class="panel-title">Job applications</h3>
        </div>
         <div class="panel-body">
            <div class="ct-line ct-golden-section" id="traffic_chart"></div>
        </div>
    </div>
</div>
<div class="col-sm-6">
    <div class="panel panel-default">
        <div class="panel-heading">
            <h3 class="panel-title">Education</h3>
        </div>
        <div class="panel-body">
            <div class="ct-chart ct-golden-section" id="edu_chart"></div>
        </div>
    </div>
</div>

<div class="col-sm-6">
    <div class="panel panel-default">
        <div class="panel-body">
            <div class="center-block" id="interview_gauge" style="width:300px; height:200px"></div>
        </div>
    </div>
</div>
<div class="col-sm-6">
    <div class="panel panel-default">
        <div class="panel-body">
            <div class="center-block" id="hire_gauge" style="width:300px; height:200px"></div>
        </div>
    </div>
</div>
Now that we have our basic libraries and page layout setup, lets move on to the fun part, connect to our database and render some nice charts. We use JQuery to connect to RestDB. To keep our data secure we also use a CORS enabled apikey, read more on how to set it up here.
/*
 Inject the API key for every call to the database.
*/
$.ajaxPrefilter(function( options ) {
  if ( !options.beforeSend) {
    options.beforeSend = function (xhr) {
      xhr.setRequestHeader('x-apikey', '56c32999a73b2a43395f93e2');
    }
  }
});
With a proper apikey we can finally connect and retrieve data from RestDB. The following function creates a query against the Application collection. We only want records from the current year, and we want them sorted by the date Field received in ascending order (i.e. from oldest to newest). The result data are then passed on to helper functions for rendering our graphs.
function createReport(){
  var now = new Date();
  var query = {"received":{"$gt":{"$date":now.getYear()+"-01-01"}}};
  var restURL = 'https://jobapplications-5c54.restdb.io/rest/applications?sort=received&dir=1&q='+JSON.stringify(query);

  // Call RestDB for some Application data
  $.getJSON(restURL, function(data){
    // call charts and gauges functions
    trafficChart(data);
    eduChart(data);
    interviewGauge(data);
    hireGauge(data);
  });
}
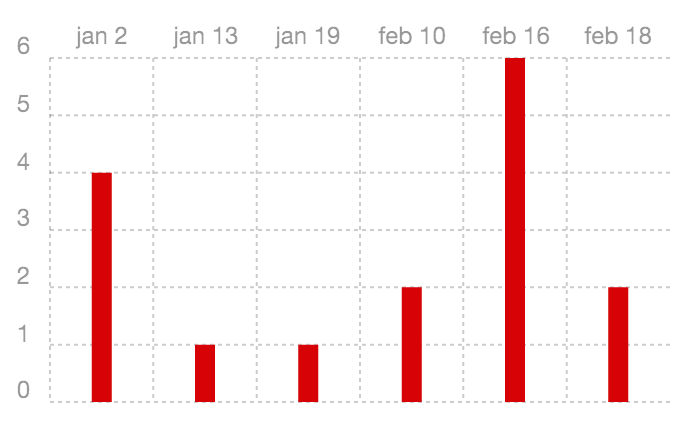
The code for the bar chart of incoming job applications is shown here.
Data is first grouped by month. Chart labels are created from this as: ['jan-01', 'jan-12', 'feb-12', ...].
The height of each bar is now just the length of each Array in the grouped data.
/*
  Create a Bar chart of Job Applications this year
*/
function trafficChart(data){
  var months = ['jan', 'feb', 'mar', 'apr', 'may', 'jun', 'jul', 'aug', 'sep', 'och', 'nov', 'dec'];
  var groups = _.groupBy(data, function(item){
    var then = new Date(item.received);
    return (months[then.getMonth()] + " " + then.getDate());
  });

   var data = {
    labels: _.map(groups, function(agroup, day){
      return day;
    }),
    series: [
    _.map(groups, function(agroup){
      return agroup.length;
    })
    ]
  };

  var options = {
    axisX: {
      position: 'start'
    },
    chartPadding: {
      bottom: 20,
      top: 10
    },
    lineSmooth: false
  };
  new Chartist.Bar('#traffic_chart', data, options);
}
The code above produces this nice bar chart:
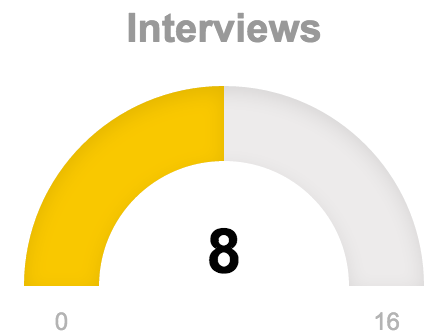
Gauges are simpler, we only need to filter our dataset on the status property, we match it for the "Interview" status.
/*
    Create a Gauge with number of interviews
*/
function interviewGauge(data){
    $("#interview_gauge").empty();
    var g = new JustGage({
    id: "interview_gauge",
    value: _.filter(data, function(item){
            return (item.status.match(/.*Interview/gi))
        }).length,
    min: 0,
    max: data.length,
    title: "Interviews"
  });
}
The code above renders this gauge showing how many interviews we have:
Its nice when a Dashboard shows live data, without needing any user input. This is done with a simple timer in Javascript, the Dashbord is refreshed each 30 second.
// Refresh dashboard each 30 sec
setInterval(function(){
    createReport();
}, 30 * 1000);
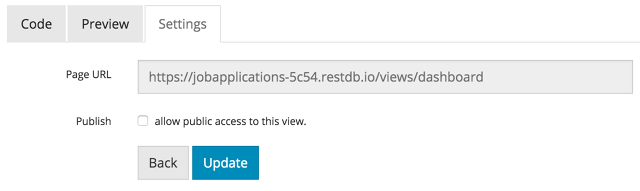
Publish your Dashboard
However, you can also publish a Page with a public direct link to the Dashboard (requires Basic database plan). Navigate to the Settings tab and check the Public access.

Full source on GitHub
You can find the complete source code and a JSON data dump at GitHub here: https://github.com/RestDB/clientexamples/tree/master/DashboardWe will also show how you can send auto email to your customers/user. Stay tuned :)
